This essay was written for Write of Passage Cohort 7, for the prompt "What is your unique perspective?"
Spoiler alert: You will be looking at graphs. And a bit of math. But not too much math. Pinky promise.
To be clear, we are not talking about the company's-quarterly-financials-on-a-pie-chart kind of graph. Here, we are talking about the nodes-and-edges kind of graph, also known as a network. Graphs visually and mathematically describe connectedness.
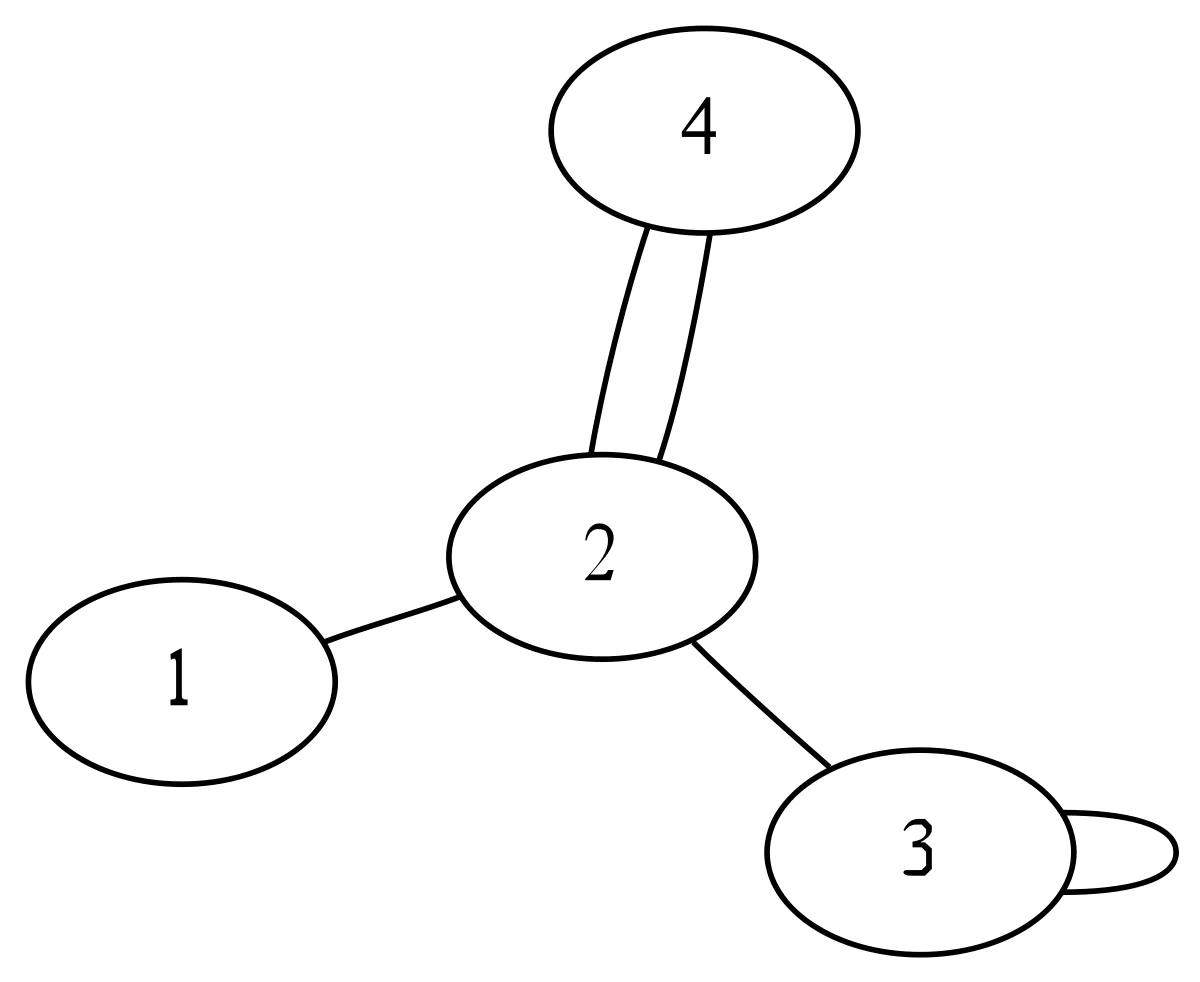
A simple graph. Source
Almost anything can be represented as a graph. Some things are obviously graphs, like your city's power grid. Some things can easily be imagined as graphs since they are naturally connected, like Wikipedia or your Twitter feed.
Where it gets interesting is when you take subjects that are not obviously graphs and find ways to represent them as graphs. A physics simulation can be a graph. Animated MMA fighting can be a graph. A sentence in this article can be a graph. Even your own thoughts and ideas are a graph.
The graph is one of the most powerful tools we have for understanding the world around us because they put connectedness center-stage. Data-driven analysis on graphs is being used to solve some of the hardest scientific problems we have left. Graphs can be used to build beautiful and functional things previously thought impossible. Framing the challenges in your own life as graphs can give you new perspective on solving them.
The Obvious Graphs
Since graphs describe connectedness between things, this makes them ideal for showing things that are actually physically connected. Think of your city's power grid or the busy streets downtown. Wires hanging overhead are connected by poles, avenues are brought together by intersections.
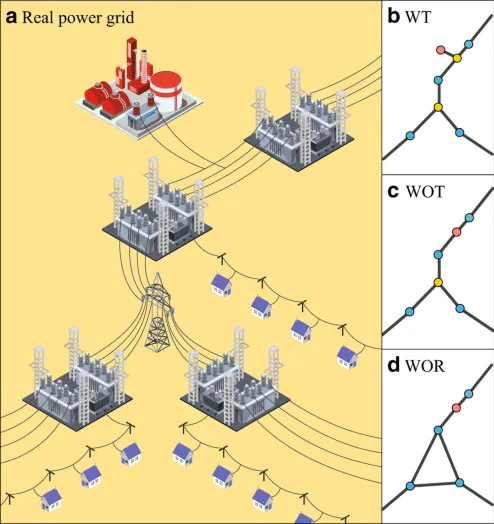
Power plants as a graph. Source
Graphs are useful for describing non-physical connections as well. They can be used to model who likes who in a 34-person karate club or links between Wikipedia's 54 million pages. Using connectedness, we can easily examine things like mutual friends and article cross-references and find interesting trends. For instance, out of Facebook's 2.85 billion users, any user is on average around 3.5 users apart from any other random user. Small world.
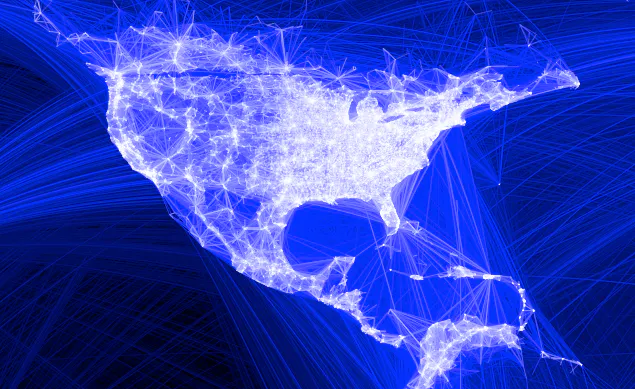
A graph of U.S. Facebook users. Source
The Less-Obvious Graphs
Sometimes it is obvious how things connect, like downtown streets crossing at intersections, or Wikipedia articles referencing one another. When it is not as obvious how things should be connected, we must find creative ways to decide what makes a connection.
Here's an example of a non-obvious graph: this sentence you're reading right now. The simplest graph representation of a sentence is a path graph, where the first word connects to the second, the second to the third, etc. But you may remember mapping subjects to objects and identifying the verbs in a sentence from your high school English class. Language has dependencies which connect backwards and forwards through sentences and paragraphs.
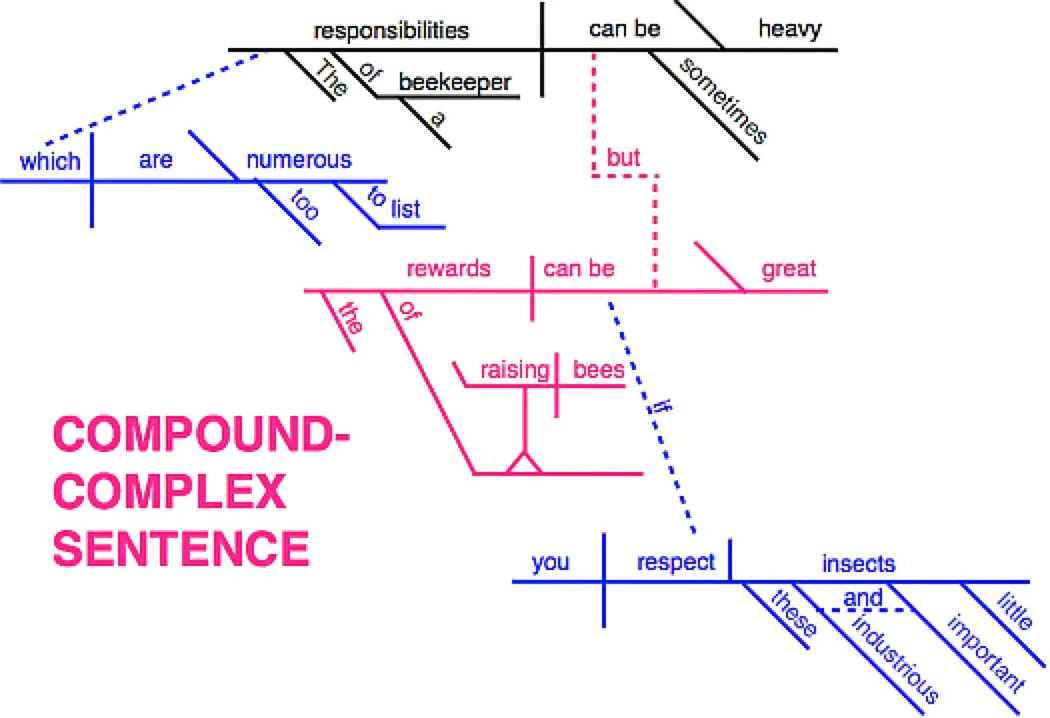
A sentence, remapped. Source
Taking advantage of the tree-like structure of language has allowed for applications such as solving math word problems. This is a possibly better approach than traditional text-mining methods due to the highly structured, right-or-wrong nature of answering these problems.
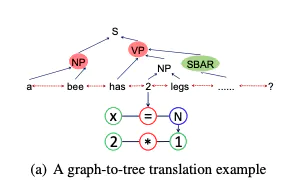
A bee has two legs. How many legs does one bee have? Source
Another major breakthrough occurred in physical science in DeepMind's AlphaFold. AlphaFold is a solution to the protein folding problem, which is the task of predicting a protein's 3D structure from its amino acid sequence. AlphaFold is able to do this by representing the protein as a 'spatial graph', where the amino acids are the nodes, and the distance between the acids is how the edges are defined. Amino acids that are 'close enough' to one another are connected.
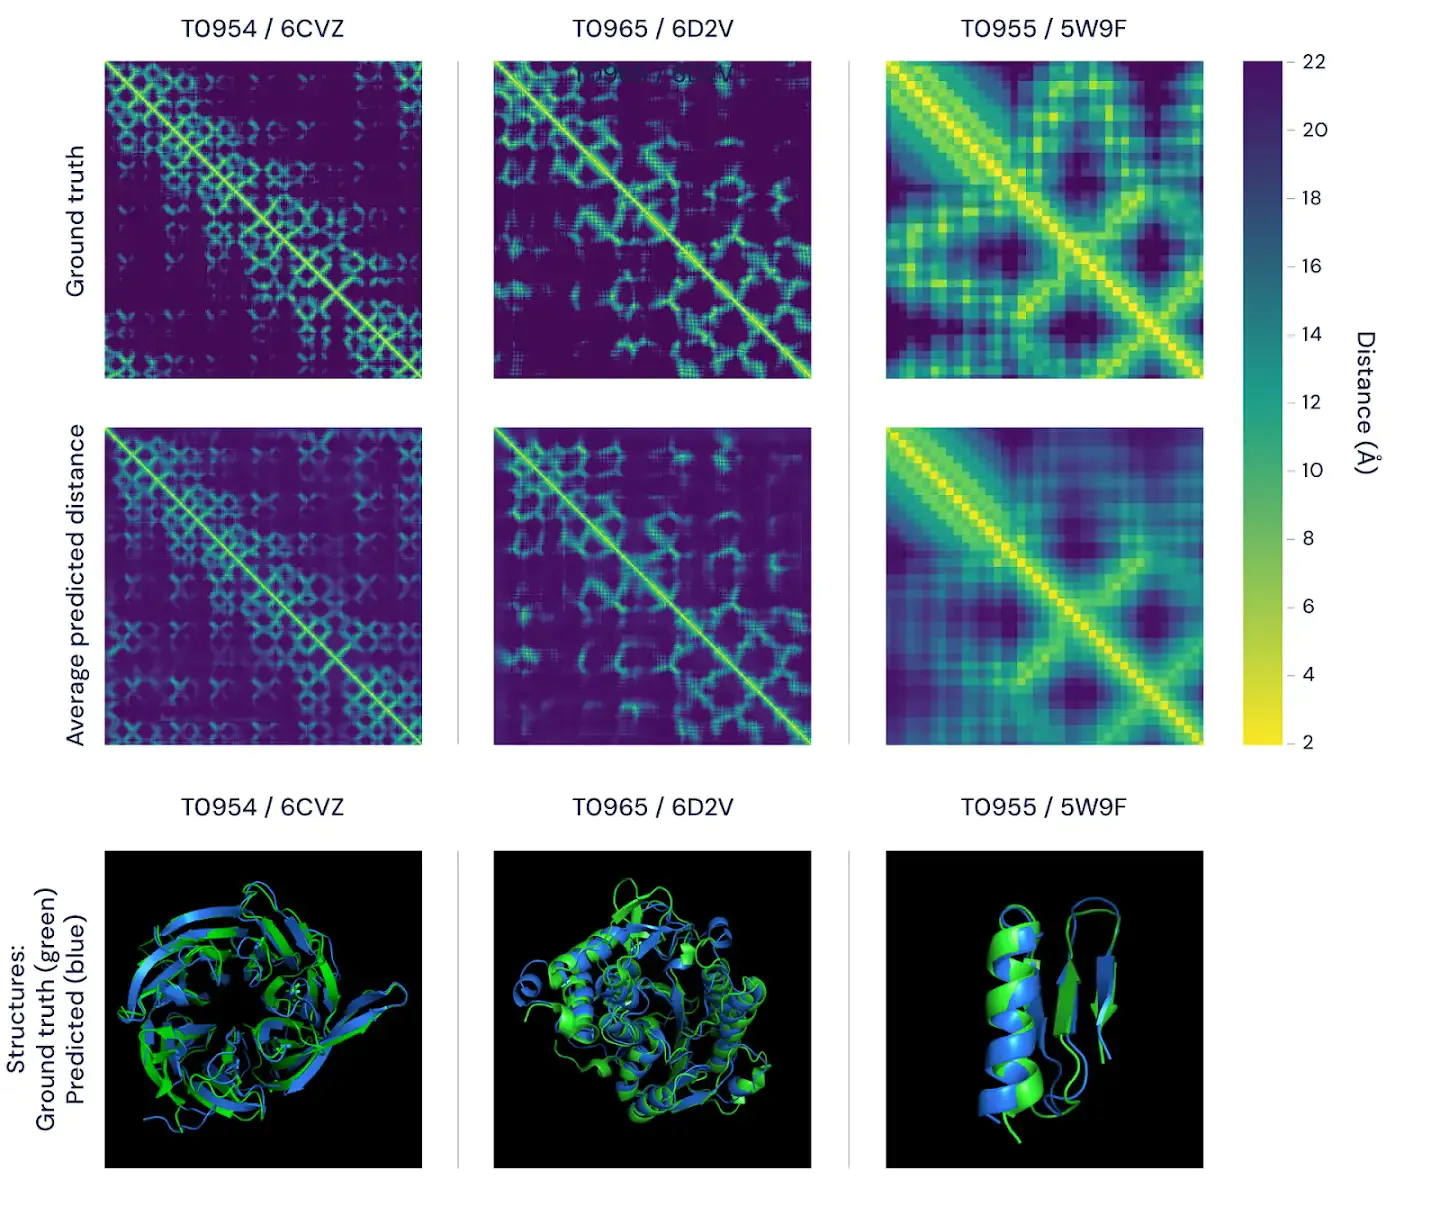
Protein Folding. Source
A similar proximity graph approach can be used in other physical simulations to do things such as simulate cloth in the wind or animate fluid-looking martial arts.
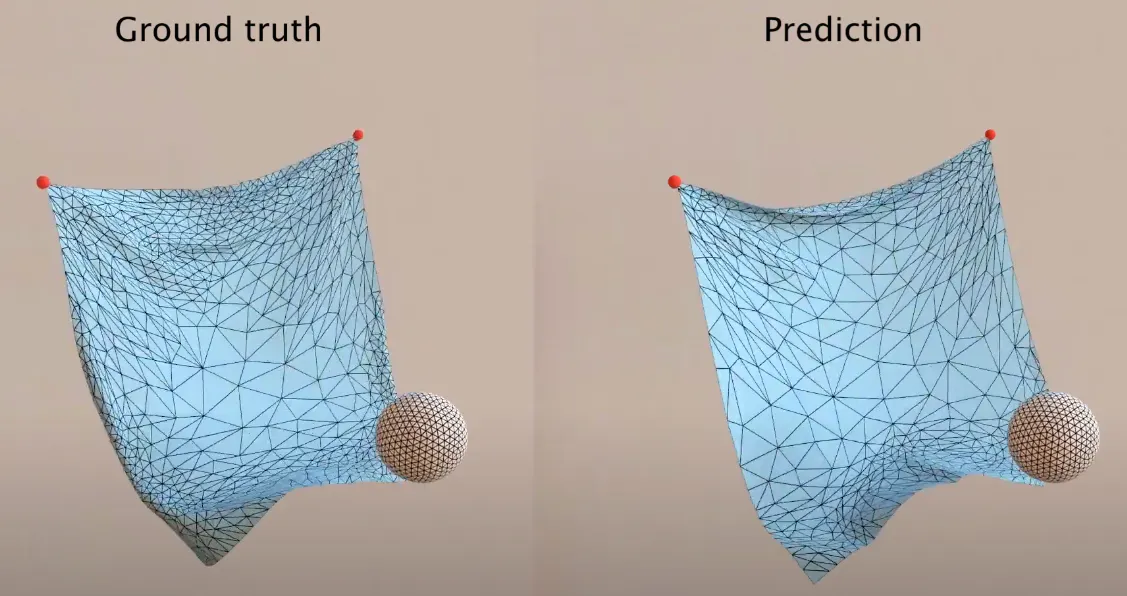
A sheet in the wind. Source
Graphs and You
Thinking of the problems you wrestle with in your life as graphs can help to give you a new perspective on how to solve them. Thinking of your friend network can help you decide that it makes sense to introduce these two of your friends that do not know one another. Thinking of your ideas and thoughts as a network can help you to find those truly unique connections you can build a career around. And you can think of minutes, days, and years as the unbroken chain graph that underpins everything you do.
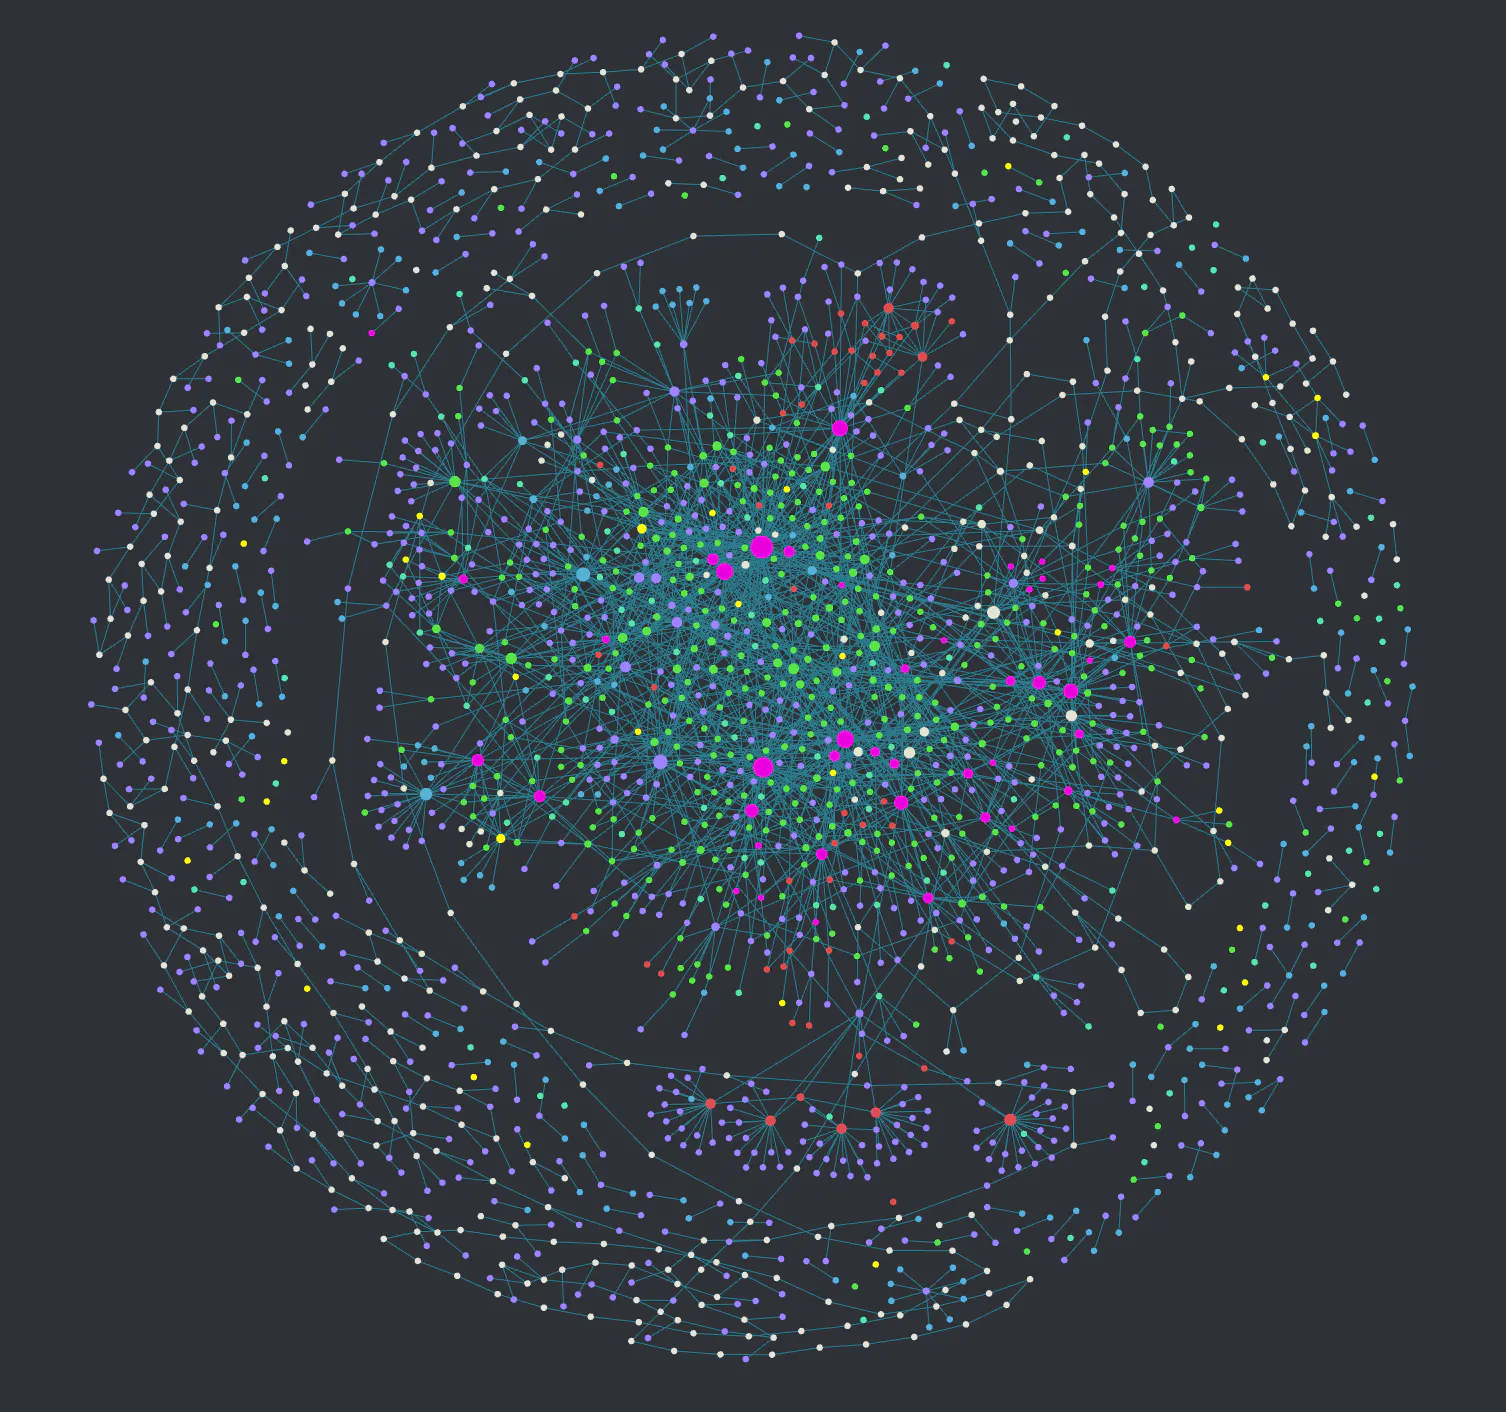
My Obsidian personal knowledge graph, as of writing.
Fetching Replies...
Do you have any questions, comments or simply wish to contact me privately? Don’t hesitate to shoot me a DM on Twitter.
Want more jmill in your life?
Get a monthly email from me about my ideas, as well as exclusive previews of upcoming articles and projects.
Everything around us is either already a graph, or can be represented as a graph with a little bit of elbow grease.